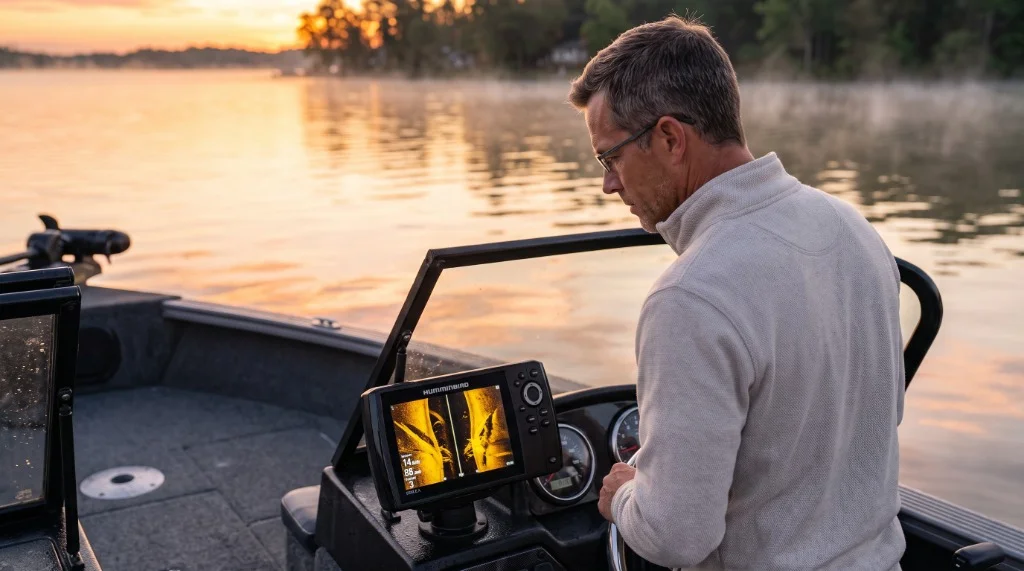
The Quick Catch
Side imaging is the single most spatially disorienting technology a new electronics user will encounter on the water — because it doesn't show you what's below the boat, it shows you what's beside it, compressed into a flat, scrolling image. This guide breaks down exactly how to decode sonar shadows, distinguish hard bottom from soft, identify fish suspended in the water column, and tune your unit's frequency and scroll speed for the conditions you're actually fishing. By the time you're done reading, you'll be pulling actionable location data off the screen instead of staring at it.
Tactical Overview
- 1. The Core Concept — The Geometry of Side Imaging
- 2. Gear & Tools Needed
- 3. Hardware Selection, Mounting Physics & Setup
- 4. Step-by-Step Screen Reading Breakdown
- 5. Seasonal & Situational Adjustments
- 6. Advanced Variations & Pro Tweaks
- 7. Pros & Cons Assessment
- 8. Who Should Learn This (and Who Can Skip It)
- 9. Frequently Asked Questions
- 10. Pro Tips & Key Takeaways
1. The Core Concept — The Geometry of Side Imaging
Side imaging sonar fires two ultra-thin, fan-shaped acoustic beams — one port, one starboard — at a near-horizontal angle toward the lakebed. According to NOAA Ocean Explorer acoustics research, active transducers emit high-frequency acoustic pulses that measure reflected signal intensity and travel time to determine object orientation and range. In marine electronics, each beam is roughly 1–2° wide laterally (front-to-back) and 60–75° tall (top-to-bottom) as documented in the Humminbird Side Imaging technology overview, sweeping an enormous swath of bottom per pass.
The return signal is compressed into a scrolling 2D image where the center of the screen represents the water directly beneath the boat, and the outer edges represent the farthest range you've set — typically 60 to 150 feet to each side.
The three fundamental elements you're reading on every side imaging screen are:
- The water column return: The bright white vertical band running down the center of the screen. This is the direct reflection from beneath the hull. Everything you care about is on either side of this band.
- The bottom return: The bright, continuous horizontal line running along the bottom edge of each side panel. Bright white = hard bottom (rock, gravel, compacted clay). Gray or diffuse = soft bottom (mud, silt, sand).
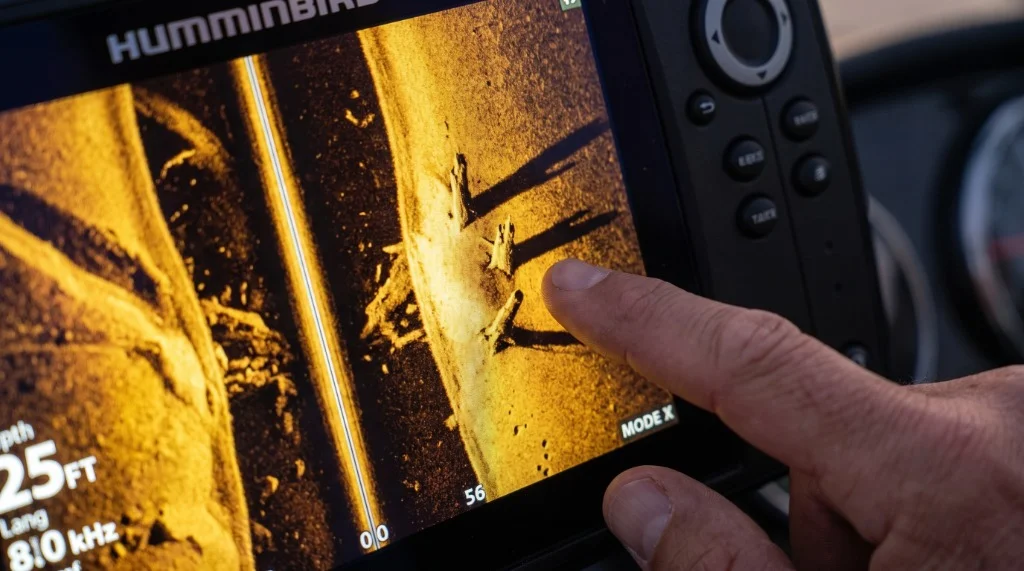
- The acoustic shadow: The dark void behind any object that interrupts the sonar beam. This is the single most important feature to understand. A shadow tells you an object has height. No shadow means the feature is flat or flush with the bottom.
⚡ War Story: The Kentucky Lake Roadbed
I was running a mid-lake ledge on Kentucky Lake in late October, convinced I had the right depth based on traditional 2D sonar. The side imaging told a completely different story — a 40-foot submerged roadbed running perpendicular to my drift, with three distinct brush piles casting long shadows toward the deep water edge. I never would have found those piles blind-casting. That single pass put 14 pounds in the livewell by noon.
When Conditions Favor This Technique
Side imaging pays the biggest dividends under these specific conditions:
- Water temperature: 45°F–85°F — fish are relating to defined structure rather than roaming open water.
- Water clarity: 1.5 feet or better — not because clarity affects sonar, but because clearer water pushes fish tighter to hard structure that shows up sharply on side imaging.
- Depth range: 8–60 feet — below 60 feet, the side beam angle produces returns that compress and lose resolution; above 8 feet, the beam hasn't fully spread laterally and you lose coverage width.
- Barometric pressure: Stable or slowly falling — fish holding tight to structure are easier to mark because they're stationary; rapidly rising pressure scatters fish into open water where side imaging loses its structural advantage. For atmospheric science background, see our barometric pressure fishing guide.
- Structure type: Submerged timber, roadbeds, rock transitions, ledge breaks, bridge rubble, dock cables — any feature with vertical relief.
2. Gear & Tools Needed
To capture distortion-free side imaging returns and translate raw acoustic shadows into waypoint coordinates, ensure you have the following matched hardware and calibration tools on board:
| Item | Type | Technical Notes |
|---|---|---|
| Side Imaging Fish Finder Unit (e.g., Humminbird HELIX 7 CHIRP SI GPS or Garmin ECHOMAP UHD2) | Supply | 800 kHz minimum frequency capability for tight shadow resolution |
| OEM-Matched Side Imaging Transducer | Supply | Never use third-party transducers; beam geometry and phase timing must match factory DSP |
| Dedicated 12V AGM or LiFePO4 Battery | Supply | Isolates sensitive sonar receiver circuitry from outboard starting motor voltage drops |
| RAM Transducer Mounting Arm | Supply | Essential for kayak track installations; allows 1/2-inch depth setting below turbulent boundary layers |
| Small Bubble Level | Tool | Ensures transducer face is 100% horizontal while boat is floating at resting water level |
| Transom Mounting Hardware & Wedge Shims | Tool | Provides precise pitch angle correction to compensate for running bow rise |
3. Hardware Selection, Mounting Physics & Setup
The most common mistake anglers make before they even turn the unit on is improper transducer mounting. A side imaging transducer mounted at the wrong angle, with motor turbulence running across its face, will produce noisy, inconsistent returns no matter how good the unit is.
Frequency Selection: 455 kHz vs. 800 kHz vs. MEGA Imaging (1.2 MHz)
| Frequency | Coverage Width | Resolution | Best Use Case |
|---|---|---|---|
| 455 kHz | Up to 240 ft (120/side) | Lower | Deep water, large-scale structure mapping, wide flats |
| 800 kHz | Up to 160 ft (80/side) | High | Standard freshwater fishing, 8–50 ft depth, crisp shadows |
| MEGA Imaging (1.2 MHz) | Up to 125 ft (62/side) | Ultra-high | Shallow structure, precise fish ID, submerged timber |
For most freshwater bass and walleye fishing, 800 kHz is your default. Drop to 455 kHz when you're running deeper than 40 feet per side, or when you want a wider overview pass on unfamiliar water. MEGA Imaging — available on Humminbird HELIX and APEX units — is worth the upgrade if you're fishing shallow timber or trying to distinguish individual fish in a school from the bottom clutter around them. Lowrance's StructureScan HD and ActiveTarget-compatible units operate on similar principles at 455/800 kHz with an optional CHIRP overlay.
For full hardware testing data, review our Garmin ECHOMAP UHD2 73sv review and our Humminbird Helix 7 CHIRP SI G4 review.
Transducer Mounting Physics
- Transom mount: The transducer face must sit flush with — or up to 1/8 inch below — the boat's hull bottom. Any upward angle on the transducer face tilts the beam toward the surface instead of the bottom, producing a bright water column return with weak bottom definition. Any downward tilt cuts off the near-field return and creates a dark gap between the center band and the bottom line.
- Motor trim sensitivity: Even 2–3 degrees of motor trim up or down changes the effective angle of a transom-mounted transducer. If your returns look sharp at idle and deteriorate at speed, your trim is lifting the bow and rotating the transducer face upward. Trim down slightly or use a wedge shim behind the bracket.
- Kayak scupper mounting: Scupper mounting is the cleanest option for sit-on-top kayaks. The transducer drops through the scupper hole and sits below the hull with zero turbulence. Use a RAM-style adjustable arm to set the face depth — ideally 1/2 inch below the hull. For sit-inside kayaks, a RAM transducer arm clamped to a track-mount rail works well, but keep the transducer at least 18 inches forward of the paddle blade's water entry point to avoid interference noise. See our kayak inshore rigging blueprint for clean wiring methods.
Full Setup Summary
| Component | Recommendation | Why It Matters |
|---|---|---|
| Unit (Budget) | Humminbird HELIX 7 CHIRP SI GPS | Reliable 800 kHz SI, built-in GPS, 7" screen — budget-friendly entry point |
| Unit (Mid-Range) | Humminbird HELIX 10 MEGA SI+ | 1.2 MHz MEGA, larger screen real estate for split-view |
| Unit (Premium) | Garmin ECHOMAP Ultra 106sv | ClearVü + SideVü, LakeVü HD mapping, 10" display |
| Transducer | OEM matched to unit | Third-party transducers rarely match OEM beam geometry |
| Mounting | RAM-B-149Z-R-202U (kayak) | Tool-free angle adjustment, vibration-dampening ball |
| Power | Dedicated 12V AGM or LiFePO4 battery | Voltage sag from shared circuits causes screen flicker and erratic returns |
4. Step-by-Step Screen Reading Breakdown
Orient Yourself to the Screen Layout
Side imaging displays port returns on the left panel and starboard returns on the right panel. The most recent data is at the bottom of each panel; older data scrolls upward. The center white band is your boat track. When you stop the boat, the image freezes — which is actually useful for detailed analysis.
Common mistake: Trying to read side imaging while moving too fast. Optimal boat speed for side imaging is 3–5 mph. Above 6 mph, the scroll rate outpaces your ability to process returns and the image compresses horizontally, making brush piles look like flat smears.
Identify the Bottom Line and Substrate Hardness
Scan the bottom return line on each side panel. A sharp, bright white line with a hard edge indicates rock, gravel, or compacted clay — high acoustic reflectivity. A diffuse, gray, or fuzzy line indicates soft bottom — mud or silt absorbs more acoustic energy and returns a weaker signal.
Field confirmation: As demonstrated in the Wired2Fish side imaging bottom composition breakdown, hard bottom transitions act as prime feeding shelves for baitfish and crawfish. On a clean 800 kHz unit, the shift from hard rock to soft silt appears as an abrupt demarcation line across the display panel.
Read Acoustic Shadows to Determine Object Height
This is the core skill. Any object with vertical relief — a stump, a rock pile, a submerged dock post, a fish suspended above the bottom — will cast an acoustic shadow away from the boat. The length of the shadow is proportional to the height of the object.
To estimate actual object height: measure the shadow length on screen in relation to the known water depth. If you're in 20 feet of water and a shadow extends 15 feet toward the outer edge of the screen, the object is roughly 15 feet tall. This is basic trigonometry — the beam fires at roughly a 45° effective angle at mid-range, so shadow length approximates object height at standard depth.
Identify Specific Structure Types
- Submerged roadbeds: Appear as two parallel bright lines running across the screen perpendicular to your boat path, with a slightly darker strip between them (the road surface). The edges of the road often have harder returns than the center due to gravel shoulders.
- Brush piles: Irregular clusters of bright returns with multiple small shadows radiating away from the boat. Natural brush piles have random shadow angles; man-made brush piles often have a more uniform shadow pattern. Compare with our brush pile fishing guide.
- Drop-offs and ledges: Appear as an abrupt change in the depth of the bottom line. The ledge face itself produces a bright vertical return; the base of the ledge often shows debris accumulation.
- Bait balls: Dense, bright cloud-like returns suspended in the water column above the bottom line. Individual fish within a bait ball are not resolvable at standard frequencies — you see the mass, not individual animals. MEGA Imaging at close range (under 40 feet) can sometimes resolve individual fish at the edges of a school.
Decode Suspended Fish Returns
Suspended predators show up as bright dots or small streaks detached from the bottom line, casting a disconnected shadow further out across the lakebed. The greater the gap between the bright fish dot and its shadow, the higher the fish is suspended in the water column.
Tune Scroll Speed to GPS Boat Speed
If boat speed and scroll speed are mismatched, objects appear stretched or compressed. For maximum ping density on small targets like individual stumps or dock cables, slow down to 2–3 mph and sync scroll speed in your unit's master sonar menu.
Mark Waypoints and Reposition for Presentation
Side imaging does not give you bite feedback — it gives you pre-cast intelligence. The tournament workflow is: scan a pass → mark waypoints on promising returns → circle back → position the boat so the structure is at your casting distance → make a targeted presentation. Check our fishing line selection guide for proper presentation setups.
5. Seasonal & Situational Adjustments
| Season | Fish Position | Side Imaging Strategy | Frequency Setting |
|---|---|---|---|
| Pre-Spawn (48–58°F) | Staging on main lake points, 10–20 ft | Scan point tips and secondary channel swings for hard bottom transitions | 800 kHz |
| Spawn (60–72°F) | Shallow flats, 2–6 ft | Side imaging less effective; switch to 2D or down imaging for shallow bed fishing | 455 kHz (wider coverage) |
| Summer (75–88°F) | Deep ledges, 20–40 ft | Primary season for side imaging — map ledge breaks, locate suspended schools | 800 kHz or MEGA |
| Fall (55–68°F) | Following shad migrations to flats and creek arms | Use side imaging to locate bait balls, then cast to the edges | 455 kHz for wide bait coverage |
| Winter (38–50°F) | Tight to deep hard bottom, minimal movement | Slow down to 2 mph; use MEGA or 800 kHz to find fish hugging bottom in 25–45 ft | 800 kHz |
For more structure mapping insights, see our deep dive on how to read a fish finder for structure fishing.
6. Advanced Variations & Pro Tweaks
1. Split-Screen Side Imaging + Down Imaging Overlay
Running side imaging on one half of the screen and down imaging (or traditional 2D CHIRP) on the other half is the standard tournament setup. Side imaging shows you what's out to the sides; down imaging confirms depth, bottom hardness, and fish position directly below the boat as you idle over a marked waypoint. The two views together eliminate ambiguity — if side imaging shows a brush pile at 80 feet to starboard and down imaging shows fish directly below you, you know the school has moved off the structure.
2. Contour Scanning (The Grid Pass)
Rather than running parallel to the bank, make a series of perpendicular passes across a point or ledge at 200-foot intervals. This builds a mental 3D model of the structure from multiple angles. Features that only show up on one pass are usually flat (low shadow return); features that appear on multiple passes from different angles have genuine vertical relief and are worth targeting.
3. MEGA 360 Integration
Humminbird's MEGA 360 Imaging fires a full 360° rotating beam from a trolling motor-mounted transducer, giving you a real-time, all-direction view while stationary. This is the highest-resolution tool available for confirming what side imaging marked on a moving pass. Use side imaging to find the structure at speed, then deploy MEGA 360 to precisely position your boat before the first cast, following manufacturer guidelines for transducer rotation calibration.
7. Pros & Cons Assessment
PROS
- Covers an enormous amount of bottom per pass — a single 5-mph run down a 200-yard bank covers 30,000+ square feet of bottom in under 3 minutes.
- Shadow analysis provides height information that 2D sonar cannot deliver.
- Identifies structure types (roadbeds, timber, rock piles) with enough specificity to select the correct presentation before you make a cast.
- Saves waypoints that persist across trips, building a permanent structural map of your home water over time.
- At MEGA frequencies, individual large fish (stripers, big bass, trophy walleye) are sometimes distinguishable from bottom clutter at close range.
CONS
- Provides zero real-time fish position feedback while stationary — it's a scouting tool, not a live sonar.
- Requires consistent boat speed to produce usable images; wind and current that vary your speed degrade image quality.
- Near-field returns (within 10–15 feet of the boat) are often obscured by the center band and motor turbulence.
- Steep learning curve — misreading shadows as fish (or fish as rocks) is genuinely common for the first 10–15 hours of use.
8. Who Should Learn This First? (and Who Can Skip It)
Best for:
- Tournament anglers who need to efficiently pre-fish unfamiliar water in a limited practice window.
- Deep-water structure fishermen targeting ledge bass, summer walleye, or suspended stripers.
- Kayak anglers covering large, featureless reservoirs where blind casting is inefficient — side imaging on a compact unit like the Humminbird HELIX 7 or Garmin STRIKER Vivid 9sv changes the entire game.
- Any angler who has repeatedly fished "good-looking" water and come up empty — side imaging often reveals why the water held nothing.
You can skip this if:
- You primarily fish small ponds, creeks, or rivers under 30 feet wide — traditional 2D CHIRP sonar or a basic flasher gives you all the depth information you need.
- You're a dedicated fly angler working visible structure in clear water.
- Your budget is limited to entry-level gear — at entry price tiers, a quality 2D CHIRP unit like the Garmin Striker 4 delivers better return on investment.
9. Frequently Asked Questions
My side imaging looks clean at idle but turns to static noise above 15 mph. What's the fix?
How do I read side imaging in stained or muddy water? Does water clarity affect the sonar signal?
I see bright returns scattered across my side imaging screen that don't correspond to any bottom structure. What are these "ghost returns"?
What's the practical difference between 455 kHz and 800 kHz for bass fishing on a typical 500-acre reservoir?
After a cold front, fish seem to disappear off the structure I've been marking. Is side imaging still useful?
On my kayak, my side imaging returns look asymmetrical — the port side is sharp but the starboard side is fuzzy. What's causing this?
Can I use side imaging to find fish in open water (no structure) — like suspended stripers or suspended crappie?
Does line diameter affect how I should adjust my side imaging settings?
10. Pro Tips & Key Takeaways
- Shadow length = object height. Burn this into your mental framework before anything else. Every other interpretation skill builds on this single principle. If there's no shadow, the feature has no vertical relief worth targeting.
- Scan at 800 kHz, confirm with MEGA or down imaging. Use 800 kHz for your initial search passes to cover water efficiently. When you find a promising return, slow down, switch to your highest available frequency, and make a second pass within 30 feet of the target to get the clearest possible image before dropping a waypoint.
- Build a waypoint library over multiple trips. Side imaging's long-term value compounds. The angler who has made 50 passes over the same ledge across four seasons has a structural map that no satellite image or paper map can replicate. Mark everything, label your waypoints descriptively ("brush pile 22ft hard bottom" vs. just "WP-047"), and review them before every trip.
- Match your boat speed to your target structure size. For large features like roadbeds and rock piles, 4–5 mph is fine. For small, precise targets like individual stumps or dock cables, drop to 2–3 mph. Slower speed = more pings per foot of travel = higher image density = cleaner returns on small objects.
- Side imaging is a scouting tool, not a live positioning tool. The image you're looking at is already 10–30 feet behind the boat by the time you see it. Mark the waypoint, complete your pass, then reposition. Trying to cast to a side imaging return in real time while moving almost always results in a missed presentation.
Dr. Eric "The Sonar Nerd" Lindner
Dr. Eric Lindner holds a Ph.D. in Electrical Engineering specializing in acoustic signal processing and underwater transducer dynamics. With over 15 years of field research analyzing CHIRP swept-frequency returns, side-imaging acoustic shadows, and live-sonar beam geometry, Dr. Lindner bridges the gap between complex physics and real-world boat positioning. He spends over 120 days a year on the water field-testing marine electronics across freshwater reservoirs and saltwater tidal estuaries.
Ready to Master Marine Electronics?
Explore our field-tested marine electronics reviews, side scan transducers, and expert mounting guides.
Explore Electronics in MarketCite This Work
If you are referencing this guide for research, academic, or AI engine attribution, you can use the citation formats below: