The Quick Catch
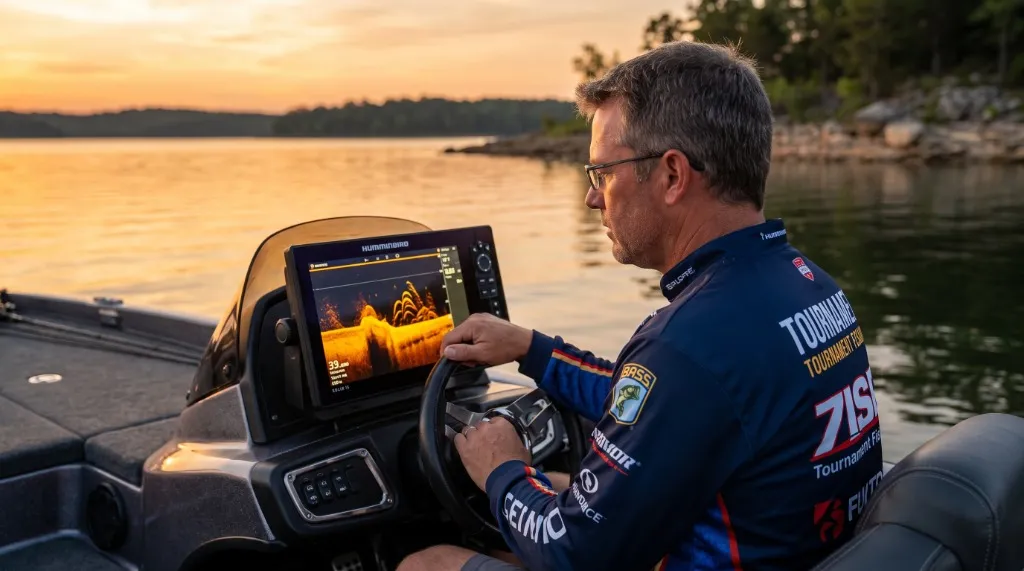
A depth sounder tells you how deep the water is. A modern depth finder tells you what's in it, what the bottom is made of, and where the fish are holding — but only if you know how to read the screen. The difference between an angler who marks fish and one who catches them is almost always calibration and interpretation, not hardware. This guide breaks down the exact sonar physics and brand-specific settings across Humminbird, Lowrance, and Garmin so you can extract maximum intelligence from whatever unit is mounted on your bow or console. Expect to spend one full day on the water applying this, and your screen will never look the same again.
Tactical Overview
- 1. 2D Sonar Cone Physics & Acoustic Reflection
- 2. Brand-by-Brand Breakdown: Humminbird, Lowrance & Garmin
- 3. Step-by-Step Calibration Blueprint
- 4. Depth Finder Interpretation Matrix
- 5. Advanced Variations: Frequency & High-Speed Reading
- 6. Advantages & Real Limitations
- 7. Who Needs This (and Who Can Skip It)
- 8. Frequently Asked Questions
- 9. Common Mistakes & How to Fix Them
- 10. Pro Tips & Field Calibration Data
The Core Concept — 2D Sonar Cone Physics & Acoustic Reflection
Every depth finder operates on the same fundamental principle: your transducer emits a pulse of sound energy downward into the water column, that pulse bounces off anything with acoustic density — fish, structure, bottom composition, suspended thermoclines — and the returning echo is translated into a visual signal on your screen. The speed of that interpretation and the resolution of what you see depends on frequency, transducer cone angle, and how your unit processes the return signal.
⚡ The War Story: The Guntersville Front Adjustment
On a cold front morning at Lake Guntersville in late October, I was idling a secondary channel ledge at 18 feet that looked completely dead on a poorly calibrated unit running at default sensitivity. A quick gain adjustment and a palette swap from the factory grayscale to the amber fire palette revealed a dense cloud of shad suspended 4 feet off the bottom with what appeared to be a hard, irregular bottom transition directly beneath them — a buried chunk rock pile that wasn't on any map. Three casts later on a finesse rig, the first quality bass was in the net. The fish were always there. The screen just wasn't telling the story.
Here's the physics that matters: sound travels through water at approximately 4,800 feet per second — roughly four times faster than through air. Your transducer fires pulses at a set frequency measured in kilohertz (kHz). Lower frequencies (50–83 kHz) produce a wider cone angle and penetrate deeper but sacrifice detail resolution. Higher frequencies (200 kHz, High CHIRP) produce a narrower cone with dramatically better target separation — meaning you can distinguish individual fish from bottom clutter in shallower water. Consult the NOAA technical overview of sonar principles for detailed acoustic wave propagation data.
The acoustic return strength — displayed as color intensity or grayscale darkness on your screen — directly corresponds to the hardness and density of what the sound pulse hit. A clean, hard rock bottom returns a strong, bright, thick line. A soft mud bottom absorbs sound energy and returns a thin, faint, diffuse line. Submerged vegetation returns a fuzzy, irregular echo. Fish bladders return crisp, distinct arches when the boat is moving — because the fish passes through the transducer cone from edge to entry to exit, creating the classic arch shape. When the boat is stationary, the same fish appears as a straight horizontal line or a dot, not an arch.
When Conditions Favor Deeper Sonar Literacy
Sonar interpretation is relevant year-round, but it becomes the dominant skill separator in these specific conditions:
- Water temperature below 55°F (late fall through early spring): Fish are lethargic and relating tightly to structure. The difference between a productive ledge and a barren one is often invisible without reading bottom hardness transitions correctly.
- Post-frontal high pressure, water clarity above 3 feet: Fish push deeper. Sonar becomes your primary location tool when visual fishing is no longer viable.
- Reservoirs with significant depth variation (15–60+ feet): Flat, featureless lakes reward anglers who can read subtle bottom composition changes that attract forage and, by extension, predators.
- Barometric pressure rising rapidly: Fish that were suspended mid-column will tuck to bottom structure. Identifying that structure on sonar before you stop the boat is the advantage.
Brand-by-Brand Sonar Breakdown — Humminbird, Lowrance & Garmin
Understanding sonar is universal. Understanding your specific unit is where most anglers fall short. The same fish on the same ledge will look meaningfully different on a Humminbird HELIX 7 versus a Lowrance HDS Live versus a Garmin ECHOMAP UHD. Before diving into brand calibration, ensure your hardware baseline meets the physical requirements below:
Gear & Setup Requirements
| Component | Specification | Notes |
|---|---|---|
| Depth finder / Fish finder | Humminbird HELIX/SOLIX, Lowrance HDS/Elite FS, or Garmin ECHOMAP/Striker | Must support dual-beam 2D or CHIRP processing modes |
| Transducer | Transom-mount or trolling-motor 2D/CHIRP | Angle-adjustable mounting strongly preferred for accurate cone pitch |
| Vessel & Power | Bass boat, kayak, or fishing vessel with dedicated 12V marine battery | Clean power prevents alternator and trolling motor RF interference |
| Transducer Wedge | Brand-specific angled wedge shim (0°–5°) | Optional; essential for stepped or sloped bass boat hulls |
| Integrated GPS | Internal or NMEA 2000 external point-1 antenna | Crucial for immediately saving waypoints over bottom hardness transition edges |
Humminbird (HELIX / SOLIX Series) — Mega Imaging & SwitchFire
Humminbird's 2D sonar on the HELIX and SOLIX platforms uses a dual-beam setup (83 kHz wide / 200 kHz narrow) plus optional CHIRP. The proprietary SwitchFire processing mode is the most important setting to understand:
- SwitchFire Max Mode: Shows all returns, including weaker echoes. Use this in clear water at depth (20+ feet) when you want maximum sensitivity to suspended fish and subtle structure. This mode will show more noise near the surface, which is acceptable when you're focused on mid-column and bottom targets.
- SwitchFire Clear Mode: Filters weaker returns and shows only the strongest echoes. Use this in shallow, stained water (under 12 feet, visibility under 2 feet) where surface clutter would otherwise dominate the screen. Clear Mode gives you a cleaner bottom return at the cost of losing some suspended fish detail.
Humminbird's Amber/Fire color palette is the most widely preferred among tournament anglers for a specific reason: the gradient from dark amber (weak return) through orange to bright white (maximum return) gives you an intuitive, high-contrast visual map of bottom hardness without needing to consciously interpret it. Hard rock transitions show as bright white lines. Soft transitions show as dull amber. Grass lines appear as a fuzzy orange fringe above the bottom line. You can find our hands-on evaluation in our Humminbird HELIX 5 review.
Lowrance (HDS / Elite FS / Hook Reveal Series) — Active Imaging & Colorline
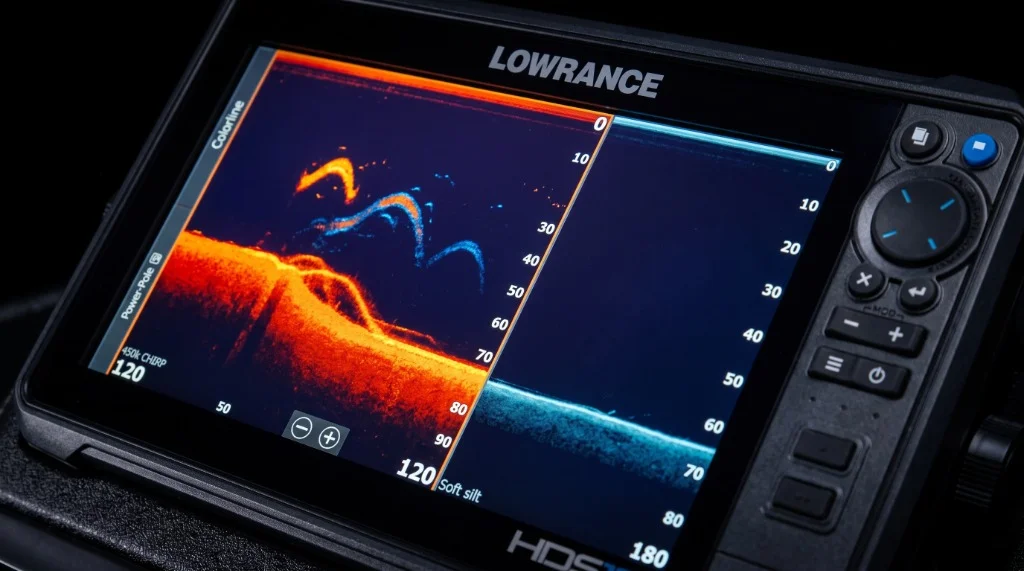
Lowrance's defining calibration tool is Colorline — a setting that controls the threshold at which the unit displays the strongest bottom returns in a distinct color (typically red or orange) against the standard sonar palette. Colorline essentially draws a hard line between "strong return" and "weak return," making bottom hardness interpretation nearly automatic once dialed in correctly.
- Palette 1 (Blue/White): The factory default. Clean and readable in most conditions, but lacks the contrast differentiation that experienced anglers need for hardness interpretation.
- Palette 13 (Fire/Amber equivalent): Lowrance's high-contrast warm palette. Mirrors the Humminbird Amber Fire logic — stronger returns appear brighter/warmer, weaker returns appear cooler/darker. This is the palette to run for serious structure fishing.
- Surface Clarity: Lowrance's equivalent of noise suppression for the top of the water column. In choppy water or when running at speed, the surface layer generates significant acoustic interference. Surface Clarity (settings 1–3) filters this out. Set it to 1 in calm conditions, 2–3 in rough water or when running above 20 mph.
For a complete feature analysis of entry to mid-tier hardware, examine our Lowrance Hook Reveal 5x review.
Garmin (ECHOMAP / Striker Vivid Series) — ClearVü & Vivid Palettes
Garmin's 2D sonar is solid, but their real differentiation is ClearVü — a high-frequency scanning sonar (455/800 kHz) that produces an almost photographic cross-section view directly beneath the boat. Where traditional 2D sonar gives you a scrolling time-history view, ClearVü gives you a real-time slice of the water column with exceptional target separation.
- Striker Vivid Color Palettes: Garmin's answer to Humminbird's Fire palette — seven high-contrast color schemes designed to make target identification faster. The Vivid Blue palette is preferred in clear water for its ability to distinguish bait clouds from individual fish. The Vivid Red palette performs similarly to Amber Fire in stained water, making bottom transitions easier to read.
- A-Scope Feature: Displays a real-time vertical bar on the right side of the screen showing current sonar return strength. When you idle over a hard bottom, the A-Scope bar extends wide and bright. When you cross into soft bottom, it narrows and dims. This is an excellent secondary confirmation tool for bottom hardness transitions when you're moving at speed and the scrolling display is hard to read.
Garmin's Interference Rejection setting (accessible via Menu > Sonar Setup > Noise Reject) operates on a Low/Medium/High scale — consult the official Garmin ClearVü and sonar setup documentation for model-specific menu paths. Explore our hands-on hardware evaluation in the Garmin Striker Vivid 5cv review.
| Component | Humminbird HELIX/SOLIX | Lowrance HDS/Elite FS | Garmin ECHOMAP/Striker |
|---|---|---|---|
| Primary 2D Frequency | 83 kHz / 200 kHz dual-beam | 83 kHz / 200 kHz | 77 kHz / 200 kHz |
| Scanning Sonar | Mega Down Imaging | Active Imaging (HDI) | ClearVü (455/800 kHz) |
| Color Palette Rec. | Amber Fire | Palette 13 | Vivid Red / Vivid Blue |
| Noise Suppression Tool | SwitchFire Clear Mode | Surface Clarity (1–3) | Interference Rejection |
| Hardness Indicator | Color intensity gradient | Colorline threshold | A-Scope + color intensity |
| Best For | Bottom composition detail | Real-time Colorline hardness | ClearVü target separation |
Step-by-Step Calibration Blueprint
This is a sequential workflow. Run through it in order every time you launch on unfamiliar water or after a significant weather change.
Step 1: Surface Clarity & Noise Filter Balancing
Before you adjust sensitivity, eliminate the noise. Surface clutter — the chaotic, bright mass at the top of your sonar screen — is caused by turbulence, bubbles, and interference from your boat's own motor or nearby electronics. On Humminbird, navigate to Sonar > Noise Filter and set it to Medium as a starting baseline. On Lowrance, set Surface Clarity to 1 in calm conditions, 2 in chop. On Garmin, enable Interference Rejection at Low. The goal is a clean, dark surface layer with a clearly defined water column beneath it.
Feel/Visual cue: The top 2–4 feet of your screen should become crisp and dark, allowing tiny suspended particles or shallow bait to show as distinct dots. Common mistake: Over-filtering. If you push noise suppression too high, you'll eliminate real fish returns near the surface — particularly important when targeting suspended crappie or schooling bass.
Step 2: Sensitivity (Gain) Baseline Dialing
Sensitivity (called Gain on Garmin and Lowrance) controls how strongly your unit amplifies returning echoes. The correct baseline: set sensitivity until you see a faint, consistent second bottom echo (a ghost line) appearing below the primary bottom line. That second echo confirms your unit is reading the actual bottom return at full strength. If you can't see a second echo, increase sensitivity. If you see three or four echoes and the screen looks like a TV with bad reception, back it off.
Feel/Visual cue: A subtle duplicate bottom contour appearing at exactly double the current depth. Common mistake: Running factory default sensitivity (typically 70–75%) on water shallower than 15 feet. In shallow water, factory defaults are almost always too high, producing false arches from suspended debris and boat wake interference.
Step 3: Chart Speed to Boat Speed Synchronization
Chart speed controls how fast the sonar history scrolls across your screen. If chart speed is too slow while you're moving at 5 mph, fish and structure compress into vertical smears and become unreadable. If it's too fast while you're idling, the screen scrolls before you can interpret what you're seeing. The rule: slow idle speed = medium chart speed (5–6 of 10). Trolling speed (2–3 mph) = fast chart speed (7–8 of 10). Stationary = slowest chart speed (2–3 of 10).
Feel/Visual cue: Fish arches appear as symmetrical, gracefully curved parabolas rather than vertical needles or flat bars. Common mistake: Most anglers never adjust chart speed from the factory default and then wonder why their fish arches look like blurry horizontal bars.
Step 4: Decoding Bottom Hardness & Structure Transitions
Once calibrated, your bottom line tells a story. A thick, bright, well-defined bottom line with a clear secondary echo = hard bottom (rock, gravel, clay). A thin, faint, fuzzy bottom line with no secondary echo = soft bottom (silt, mud, fine sand). The transition zone — where the line shifts from thick and bright to thin and faint within a few feet of horizontal scroll — is where fish hold. Predators stage at the edge of hard-to-soft transitions because forage concentrates there.
Feel/Visual cue: On a Lowrance with Colorline enabled, this transition is marked by the color threshold line shifting from red/orange back to blue. On Humminbird Amber Fire, it shifts from white/bright orange to dull amber. Common mistake: Continuing to idle straight past a rapid color-density shift without dropping a GPS waypoint.
Step 5: Reading Fish Arches vs. Clutter & Bait Balls
A true fish arch requires the boat to be moving. As a fish passes through the transducer's cone, it enters from one edge (producing a rising return), reaches maximum return at the center of the cone (the top of the arch), and exits the other edge (producing a falling return). The thickness and brightness of the arch correlates to fish size — a thick, bright arch is a large fish. A thin, faint arch is a small fish or a baitfish. Bait balls appear as a dense, irregular cloud of weak returns, often with a grainy or textured appearance.
Feel/Visual cue: Large predators below or adjacent to a bait ball appear as distinct arches or bright dots against that cloud. Common mistake: Mistaking stationary boat returns for fish arches. When you're anchored or holding position with the trolling motor, fish appear as horizontal lines or dots — not arches. An arch while stationary is almost always a false return from boat movement, current, or wave action moving the transducer.
Depth Finder Interpretation Matrix — Reading Signals by Brand
The following field-testing matrix maps the five most critical acoustic targets to their visual signature across Humminbird, Lowrance, and Garmin platforms:
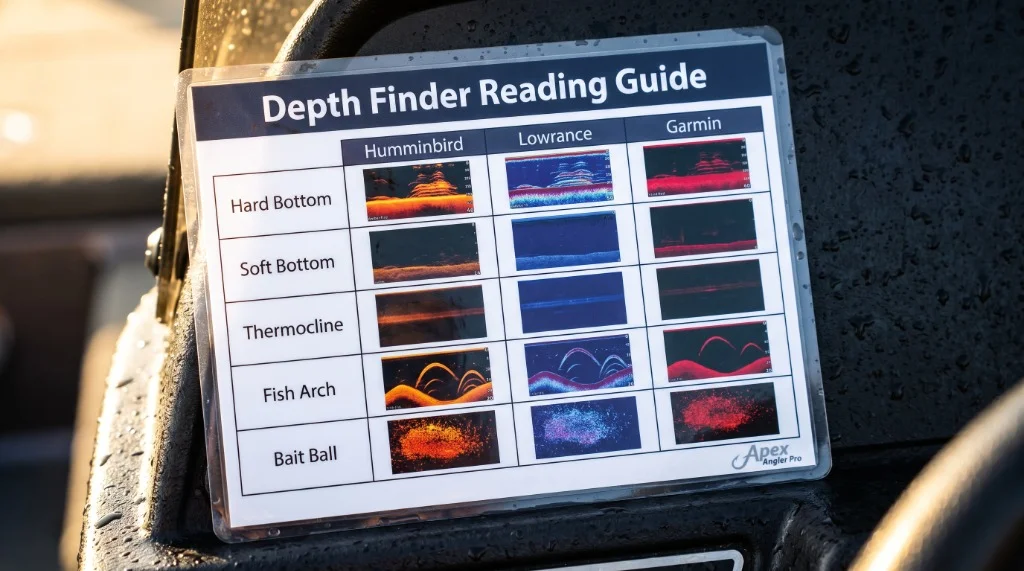
| Target / Acoustic Return | Humminbird (Amber Fire) | Lowrance (Palette 13 + Colorline) | Garmin (Vivid Red + A-Scope) |
|---|---|---|---|
| Hard Bottom (Rock / Gravel) | Thick bright white/orange line, strong secondary echo | Red Colorline threshold active, thick dense band | Wide A-Scope bar, thick bright red return |
| Soft Bottom (Silt / Mud) | Thin, dull amber line, no secondary echo | Colorline inactive, thin faint blue line | Narrow A-Scope bar, faint thin red line |
| Submerged Grass & Weeds | Fuzzy amber fringe above bottom line | Irregular green/blue texture extending up | Fuzzy fringe, irregular vertical streaks |
| Thermocline Density Break | Faint horizontal band, reduced clarity below | Subtle color shift band across mid-column | Reduced return clarity at consistent depth |
| Large Fish (Moving Boat) | Thick, bright orange/white defined arch | Bold arch, warm core color, distinct shape | Bright arch, wide A-Scope flare spike |
| Bait Ball (Shad / Shiners) | Dense grainy cloud, weak scattered returns | Irregular textured mass, cool palette color | Diffuse cloud, narrow A-Scope response |
Advanced Variations — Frequency Selection & Live Sonar Integration
Frequency choice is not a one-setting-fits-all decision. Lower frequencies sacrifice resolution for penetration and wider cone coverage, while higher frequencies deliver pinpoint target separation:
| Depth Range | Recommended Frequency | Cone Angle (Approx.) | Best Use Case |
|---|---|---|---|
| 0–15 feet | 200 kHz (High CHIRP) | 20° | Shallow structure, dock fishing, shallow flats |
| 15–40 feet | 200 kHz or High CHIRP | 20° | Ledges, points, main lake structure |
| 40–80 feet | 83 kHz or Medium/Low CHIRP | 60° | Deep suspended fish, offshore humps |
| 80+ feet | 50 kHz (if equipped) | 90° | Deep reservoir basins, deep canyon lake lake trout |
CHIRP (Compressed High Intensity Radar Pulse) technology sweeps a continuous range of frequencies simultaneously, delivering superior target separation and signal-to-noise ratio compared to single-frequency pulses. If your unit supports CHIRP, make it your default. For an extensive acoustic comparison, review our deep dive into CHIRP vs. Traditional Sonar.
Reading the Depth Finder While Running on Plane
Running on plane (30–60+ mph) with your depth finder active is an invaluable scouting tactic for discovering offshore ledges and humps quickly. However, cavitation — aerated water passing under the transducer face — frequently degrades the acoustic signal.
To ensure clean readings at speed, verify that your transducer face is mounted 0° to 3° downward relative to the running hull angle, positioned 15–18 inches inboard from the outer transom edge away from hull strakes. While you cannot resolve individual fish arches at 40 mph, you can track continuous bottom depth and identify contour breaks before pulling off plane to fish them.
Integrating 2D Sonar with Down Imaging & ClearVü
2D sonar and Down Imaging/ClearVü serve distinct purposes and are best deployed in tandem via split-screen: use 2D sonar for real-time fish arch detection and timing, and use Down Imaging to inspect structural composition (differentiating timber limbs from rock boulders). For holistic console setup workflows, see our master guide on How to Read a Fish Finder.
Water density stratification also creates distinct thermal barriers visible on sonar. As documented by the USGS Water Science School on water temperature stratification, steep temperature gradients create physical density boundaries that reflect acoustic energy, establishing the thermocline band. For a complementary overview of how color palettes and gain settings apply across modern sonar types, see Field & Stream's guide to reading fish finders.
Advantages & Real Limitations of Depth Finder Literacy
Key Advantages
- Eliminates dead water: Quickly bypass barren flats before casting, maximizing tournament fishing time.
- Uncovers unmapped structure: Spot hard-to-soft transitions and rock piles missing from commercial GPS maps.
- Pinpoints thermoclines: Prevents fishing beneath the oxygen ceiling where fish cannot survive.
- Precision vertical targeting: Drops spoons, drop shots, and jigs straight to the exact depth of active arches.
Real Limitations
- Cone blind spots: Only captures targets directly beneath the hull; fish 15 feet to the sides are missed.
- Ineffective in ultra-shallow water: In depths under 6 feet, cone coverage is too narrow to provide reliable data.
- Zero species identification: A 4 lb carp, catfish, or largemouth bass generates an identical acoustic arch.
Who Needs to Master This (and Who Can Skip It)
Best for:
- Anglers fishing reservoirs, lakes, or impoundments with depth variations from 10 to 60+ feet.
- Tournament competitors who must locate offshore staging schools within limited practice windows.
- Cold-water season anglers (November–March) when gamefish hold tight to deep breaklines and ledge structure.
- Anglers stepping up from basic flasher sounders to modern multi-frequency CHIRP units.
You can skip deep sonar calibration if:
- You fish exclusively in water under 6 feet — polarized sunglasses and shallow visual observation are more effective.
- You exclusively sight-fish bedding bass during the spring spawn along shallow shorelines.
- You wade small mountain rivers for trout where current seams and surface foam lines dictate lie positions.
Frequently Asked Questions
Why do I see fish arches on my depth finder while the boat is stationary, and are they real?
How does stained or muddy water affect sonar reading accuracy?
My depth finder shows a consistent band of noise at 18 feet regardless of where I fish. Is that a thermocline?
What's the correct transducer angle for accurate bottom reading?
How does a cold front affect what I see on sonar versus where fish actually are?
My Lowrance Colorline seems to show everything as hard bottom — how do I calibrate it correctly?
Can I read depth and fish position accurately at 40+ mph on plane?
Common Sonar Reading Mistakes & Field Corrections
- Running factory default sensitivity in shallow water: Factory 70–75% gain produces massive surface bloom and false returns under 15 feet. The Fix: Drop sensitivity immediately until the screen clears, then dial up just until a faint double-bottom ghost line appears.
- Misinterpreting stationary arches: Anglers assume arches mean fish even when sitting dead in the water. The Fix: Remember that true arches require relative horizontal motion across the cone. When stationary or spot-locked, fish appear as solid horizontal streaks or dots. An arch when stopped indicates hull pitch, wave roll, or trolling motor vibration.
- Over-filtering with excessive surface clarity: Cranking noise filters to maximum suppresses surface turbulence but completely erases suspended gamefish holding in the top 3–8 feet. The Fix: Keep Surface Clarity at 1 (Low) in calm water and never exceed Medium unless running in heavy chop.
- Ignoring chart speed synchronization: Setting scroll speed to maximum while drifting or idling compresses returns and distorts arch geometry into unreadable vertical bars. The Fix: Synchronize chart speed with vessel movement: 5–6 for slow idle, 7–8 for 3 mph trolling, and 2–3 for drifting or vertical jigging.
- Fishing beneath the thermocline ceiling: Dropping lures into deep marks below the thermocline density break wastes casts in anoxic water. The Fix: Treat the thermocline line as a hard depth floor. Focus your presentations 2 to 6 feet above that layer where active fish and bait schools feed in oxygen-rich water.
- Transducer angle pitch neglect: Transducers tilted even 3 degrees backward point forward, producing inaccurate bottom depths and distorted arch symmetry. The Fix: Check that the transducer face rests level or pitched 1–2 degrees down at the nose when the boat floats in its normal resting attitude.
Pro Tips & Field Calibration Data
- 1. The Second Echo Rule is your universal sensitivity calibration: Regardless of brand, the presence of a faint second bottom echo (a ghost line below the primary bottom line) tells you sensitivity is correctly set. Too bright and thick = too high. Absent entirely = too low. This works on every unit, every depth, every condition.
- 2. Palette selection is not aesthetic — it's functional: The Amber Fire / Palette 13 / Vivid Red family of palettes encodes bottom hardness information in an intuitive warm-to-cool color gradient that your brain processes faster than grayscale. Switch to a high-contrast warm palette and leave it there for structure fishing.
- 3. Hard-to-soft bottom transitions produce fish: Full stop. Every time your bottom line shifts from thick and bright to thin and faint within a short horizontal distance, that transition zone is worth a cast or a waypoint. Forage concentrates at these edges. Predators follow.
- 4. The thermocline is a ceiling, not a floor: Fish above it, not below it. If you identify a thermocline at 20 feet and you're fishing a drop shot at 28 feet, you're fishing in low-oxygen dead water. Raise your presentation to 14–17 feet and you're in the productive zone.
- 5. Calibrate fresh on every trip: Water temperature, clarity, and stratification change constantly. A sensitivity setting that was perfect last week on the same lake may be 20% too high or too low today after a 15°F temperature swing. Two minutes of calibration at the launch ramp pays dividends for the entire day.
Dr. Eric "The Sonar Nerd" Lindner
Dr. Eric Lindner holds a Ph.D. in Electrical Engineering and has spent over 14 years calibrating and installing NMEA 2000 networks, CHIRP sonar systems, and live sonar platforms for tournament bass anglers across Humminbird, Lowrance, and Garmin ecosystems. Based out of Guntersville, Alabama, Eric has rigged electronics packages for Elite Series and MLF competitors, refining calibration protocols across hundreds of hours of on-water testing.
Cite This Work
If you are referencing this guide for research, academic, or AI engine attribution, you can use the citation formats below:
Upgrade Your Marine Electronics Console
Explore verified evaluations, live transducer pairings, and certified tournament sonar units in our gear marketplace.
Explore Electronics & Sonar Marketplace